


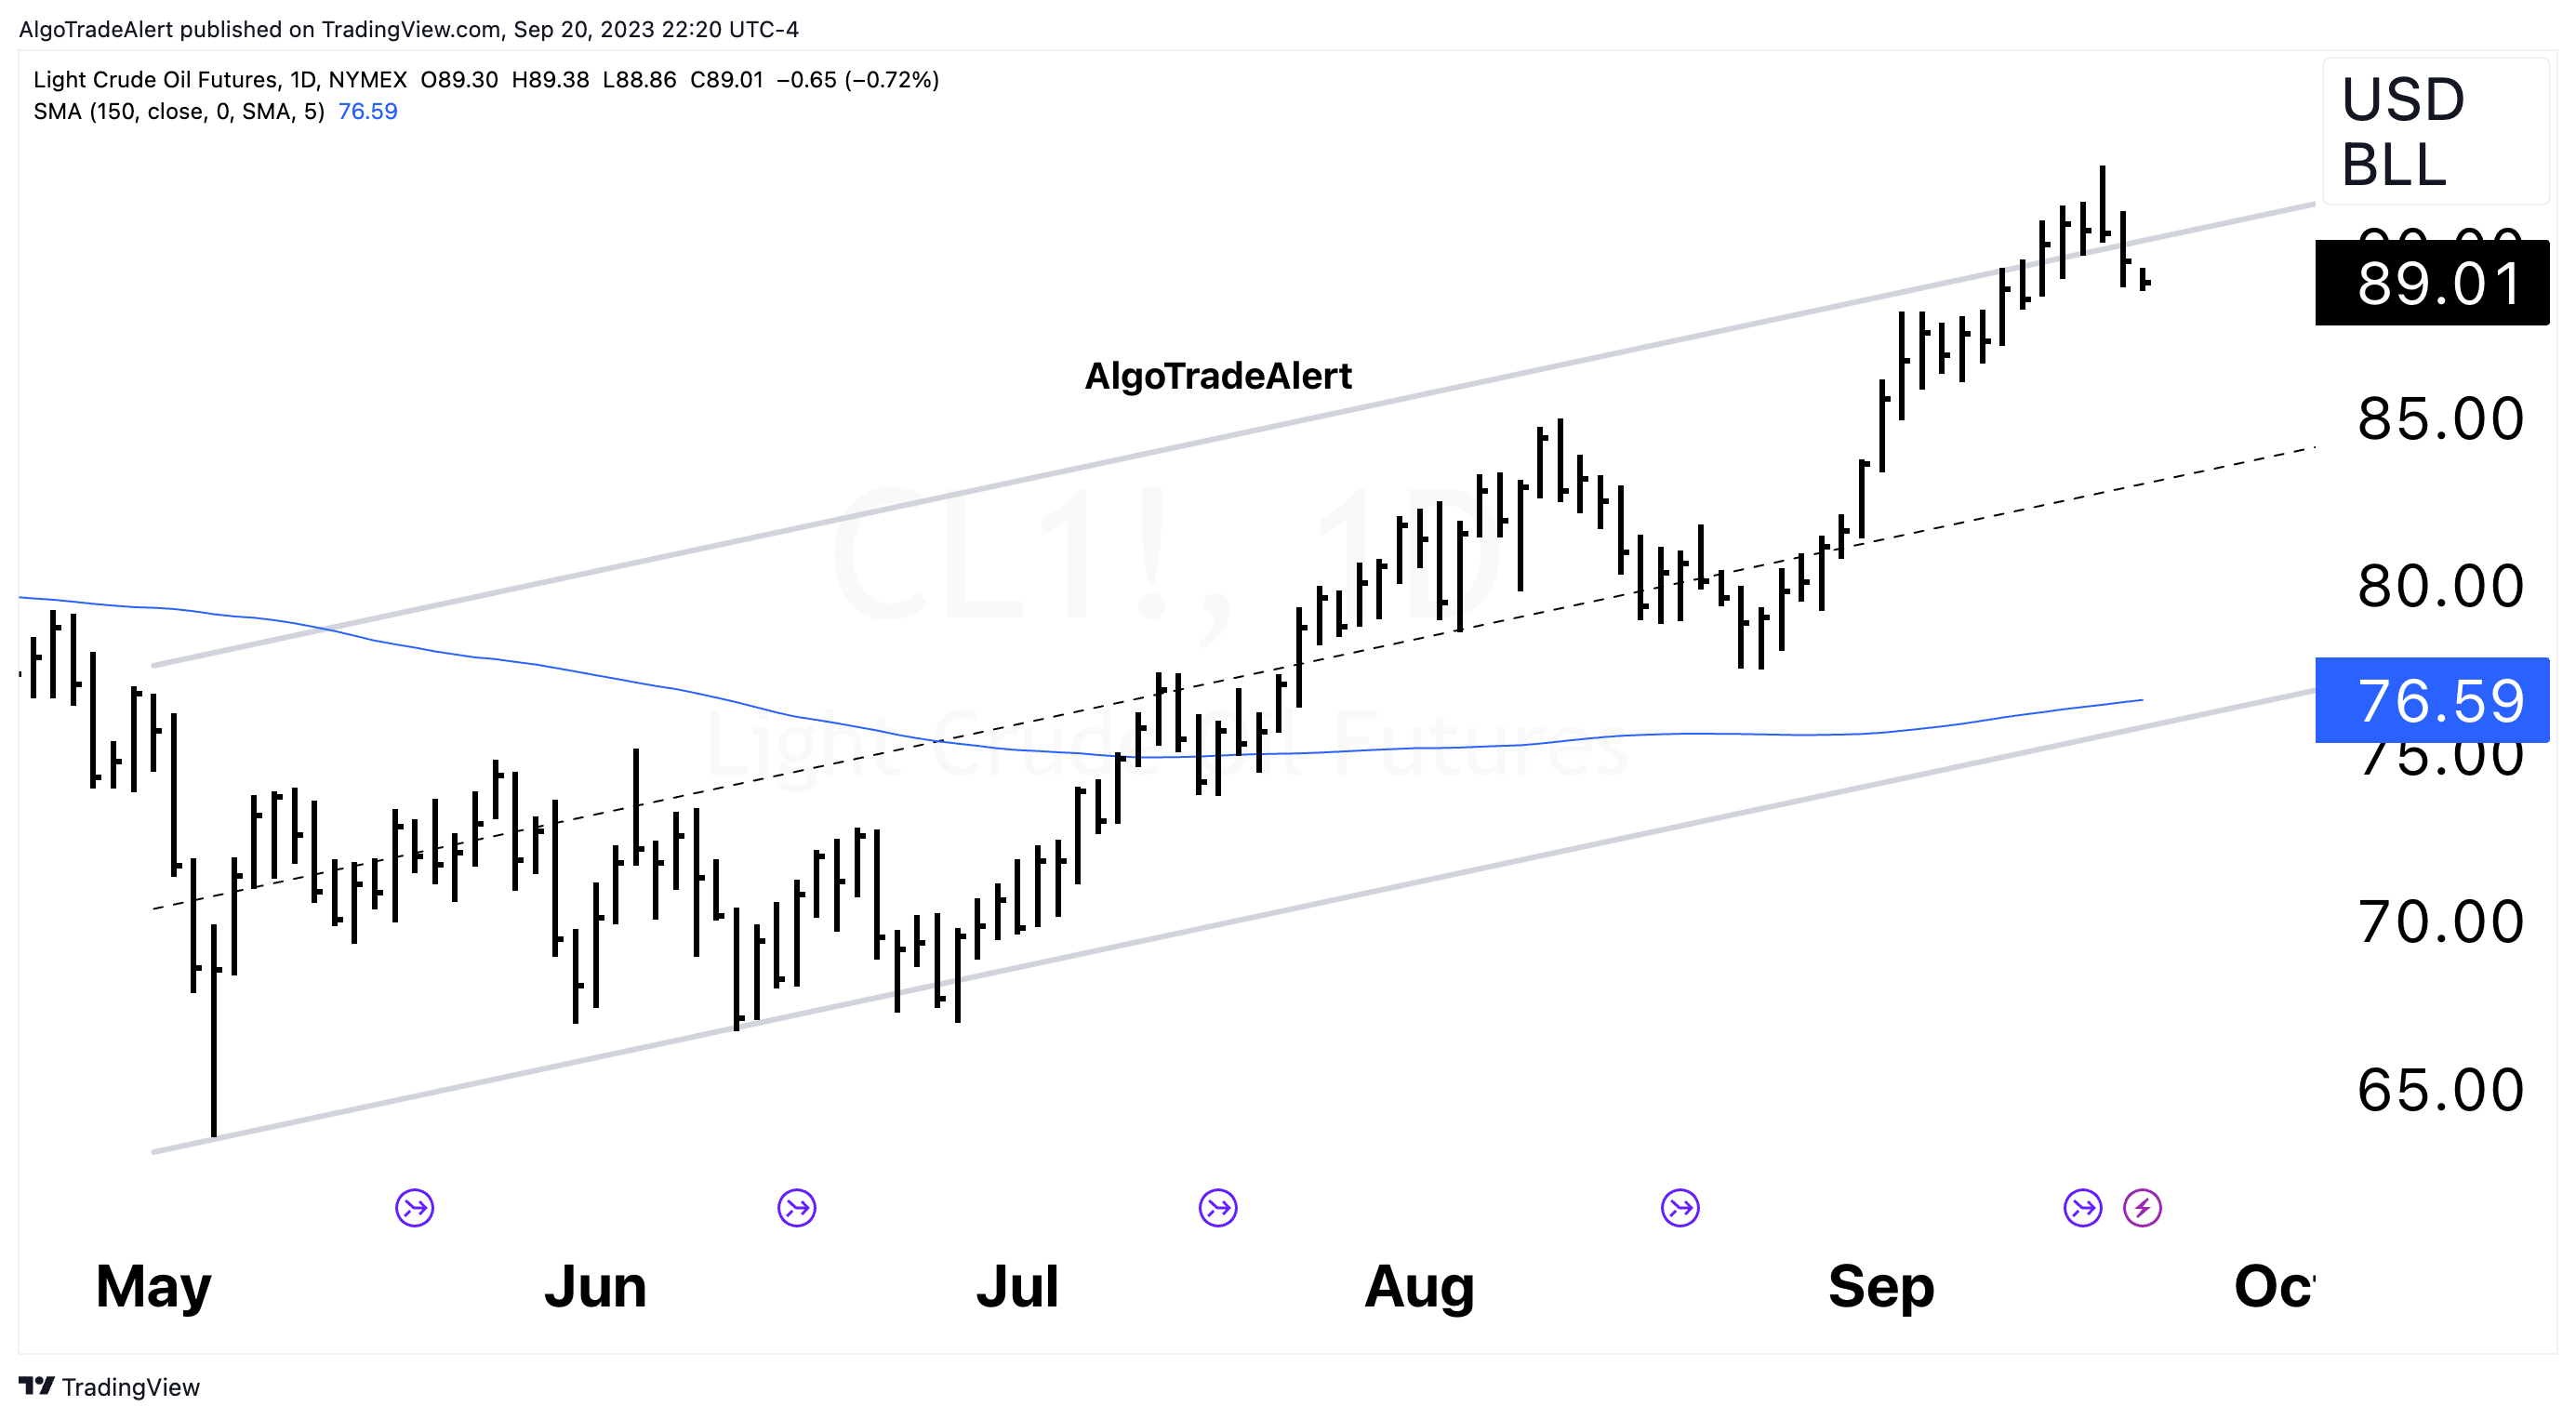
Oil Daily Chart Parallel Uptrend

A pair of doji candles, followed by a pronounced shooting star and a significant bearish candle, indicate a reversal for oil at the upper boundary of its trading channel. Immediate support is observed near the 50-day moving average and the channel's lower limit, which is approximately in the $90 range.
Keep reading with a 7-day free trial
Subscribe to Daily Stock Market Update to keep reading this post and get 7 days of free access to the full post archives.